 Back to Blogs
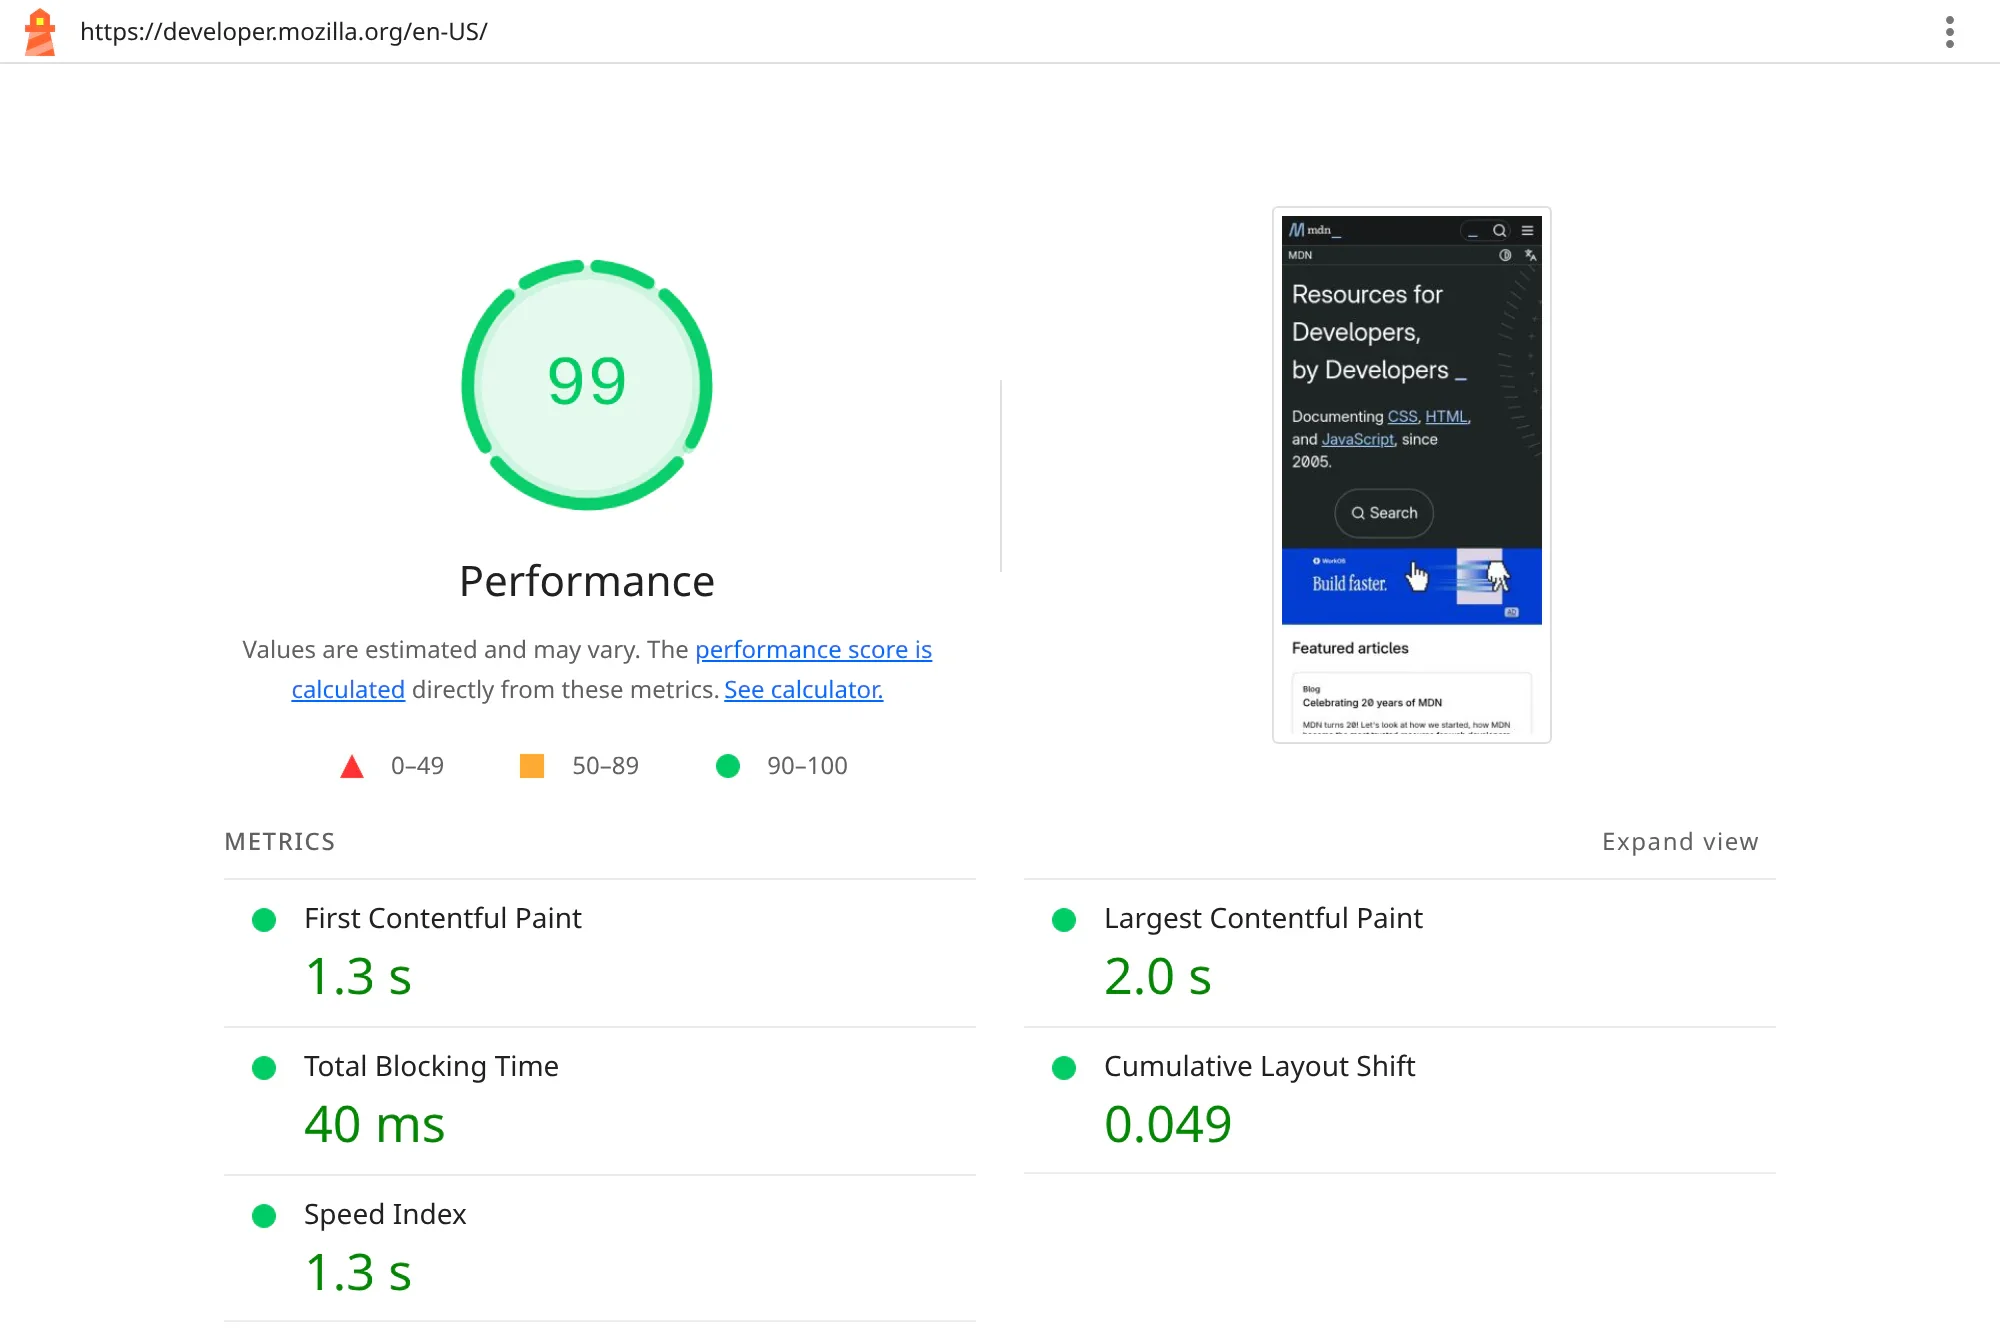
You run your site through PageSpeed Insights and the first thing you see is a red line: Core Web Vitals Assessment: Failed. Sometimes the Lighthouse score underneath is green, which makes it even more confusing. Is the site slow or not?
Speed optimization is one of the services I do most, and this exact screenshot is how many of those conversations start. In this post I will explain what the failed assessment actually means, how I find which metric is causing it, and the specific fixes I use for LCP, INP and CLS, with code you can copy.
What "Core Web Vitals Assessment: Failed" really means
Core Web Vitals are three measurements Google uses to describe how a page feels to real visitors:
- LCP (Largest Contentful Paint): how long until the main content, usually the hero image or headline, is visible.
- INP (Interaction to Next Paint): how quickly the page responds when someone taps, clicks or types. INP replaced First Input Delay as a Core Web Vital on 12 March 2024.
- CLS (Cumulative Layout Shift): how much the layout jumps around while loading.
The assessment at the top of PageSpeed Insights is not a lab test. It comes from the Chrome User Experience Report, which is real data from Chrome users who visited your page over the last 28 days. According to web.dev, a page passes only if it meets the "good" threshold for all three metrics at the 75th percentile of visits. One weak metric is enough to fail.
| Metric | Good | Needs improvement | Poor |
|---|---|---|---|
| LCP (Largest Contentful Paint) | 2.5 s or less | 2.5 s to 4 s | over 4 s |
| INP (Interaction to Next Paint) | 200 ms or less | 200 ms to 500 ms | over 500 ms |
| CLS (Cumulative Layout Shift) | 0.1 or less | 0.1 to 0.25 | over 0.25 |
Those are the same ranges listed in Google's Search Console Core Web Vitals report. This is also why a green Lighthouse score does not guarantee a pass. Lighthouse runs one simulated load on a test machine. Your real visitors use older phones, slow mobile data and pages full of third party scripts.
Why it matters for your business
Google describes good Core Web Vitals as something that "aligns with what our core ranking systems seek to reward" in its Search Central documentation. I am careful not to oversell this: great content on a slow site can still rank, and a fast site with thin content will not. The bigger reason to care is your visitors. A page that loads late, ignores taps or jumps under someone's thumb loses enquiries, whatever its ranking.
Step 1: find out which metric is failing
Before touching anything, I look at three things in PageSpeed Insights:
- Mobile or desktop. Mobile fails far more often. Fix that first.
- This URL or Origin. The toggle at the top shows whether the data is for this one page or your whole site. If only the origin has data, the problem is probably site wide, like a slow server or a heavy theme.
- Which of the three metrics is red or orange. Each one has different causes, so I never apply a generic "speed plugin" fix without knowing this.
How I fix LCP
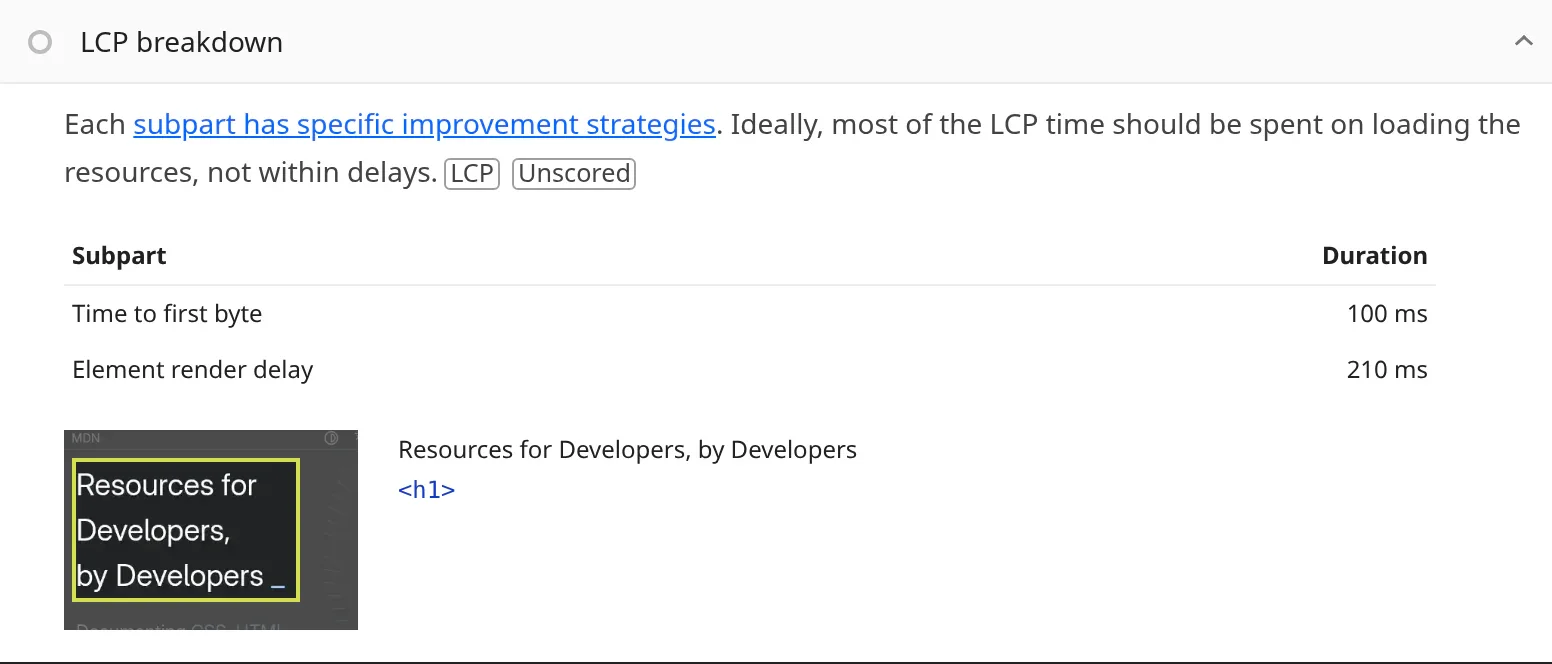
Google's LCP guide breaks the metric into four parts: server response time, how long before the browser starts loading the LCP resource, how long that resource takes to download, and how long until it is painted. In real projects, these are the fixes that move the number most.
Fix the server response first
If the first byte takes over a second, no amount of image work will save you. On shared hosting I enable page caching, turn on the host's server level cache if it has one, and make sure PHP is on a current supported version. On a custom PHP site, I cache expensive database queries and render the page without waiting on external APIs.
Make the hero image a priority, not an afterthought
The most common LCP problem I see is a hero image that is lazy loaded, set as a CSS background, or discovered late by a slider script. The browser cannot start downloading what it cannot see in the HTML. This is what the hero should look like:
<!-- In <head>: start the download early -->
<link rel="preload" as="image" href="/images/hero-1200.webp"
      imagesrcset="/images/hero-800.webp 800w, /images/hero-1200.webp 1200w, /images/hero-1600.webp 1600w"
      imagesizes="100vw" fetchpriority="high">

<!-- In <body>: a real <img>, never lazy, with fixed dimensions -->
<img src="/images/hero-1200.webp"
     srcset="/images/hero-800.webp 800w, /images/hero-1200.webp 1200w, /images/hero-1600.webp 1600w"
     sizes="100vw" width="1600" height="900"
     alt="Describe the image here"
     fetchpriority="high" decoding="async">
The fetchpriority="high" hint, explained in web.dev's Fetch Priority guide, tells the browser this image matters more than the others. Serving WebP or AVIF in a few sizes means a phone downloads an 800 pixel image instead of a 2,400 pixel one.
Remove render blocking CSS and JavaScript
Every stylesheet and synchronous script in the head delays the first paint. I inline the small amount of CSS needed for the top of the page, load the rest normally, and add defer to scripts that are not needed immediately. Web fonts get font-display: swap so text shows right away in a fallback font.
Cache static files properly
On Apache or LiteSpeed hosting, which covers most shared hosts, a few lines in .htaccess let repeat visitors load images, CSS and JS from their own device:
<IfModule mod_expires.c>
  ExpiresActive On
  ExpiresByType image/webp "access plus 1 year"
  ExpiresByType image/avif "access plus 1 year"
  ExpiresByType image/svg+xml "access plus 1 year"
  ExpiresByType text/css "access plus 1 year"
  ExpiresByType application/javascript "access plus 1 year"
  ExpiresByType font/woff2 "access plus 1 year"
</IfModule>
Only use long cache times if your file names change when the content changes, for example style.css?v=12 or a hashed file name. Otherwise visitors will keep seeing the old file.
How I fix INP
INP failures are almost always about JavaScript keeping the main thread busy, so the page cannot react when someone taps. The INP guide covers the theory. My practical order is:
1. Count your third party scripts
Chat widgets, heatmaps, several analytics tags, social embeds, A/B testing tools and ad scripts all compete for the same thread. I list every one, remove what nobody uses, and load the rest after the page is interactive or on user action. A chat widget, for example, can load when the visitor clicks the bubble instead of on every page view.
2. Break up long tasks in your own code
If a click handler does a lot of work at once, like filtering a big product list, the browser cannot paint until it finishes. Giving control back to the browser between chunks lets it update the screen in between:
// Yield to the browser so it can paint between chunks of work
function yieldToMain() {
  if (globalThis.scheduler?.yield) return scheduler.yield();
  return new Promise(resolve => setTimeout(resolve, 0));
}

button.addEventListener('click', async () => {
  showSpinner();               // visible feedback straight away
  await yieldToMain();         // let that paint happen

  for (const chunk of chunks(items, 50)) {
    renderItems(chunk);
    await yieldToMain();       // keep each task short
  }
  hideSpinner();
});
scheduler.yield() is not supported in every browser yet (see MDN), which is why the function falls back to setTimeout.
3. Watch out for heavy page builders
On WordPress, a page builder plus a dozen add ons can ship a lot of JavaScript to every page. Sometimes the right fix is cleaning up the builder output on your main templates. Sometimes it is rebuilding the key pages lighter. I tell clients honestly which one their site needs.
How I fix CLS
CLS is usually the cheapest of the three to fix, and the CLS guide lists the usual suspects. These cover most cases:
- Give every image and video a size. Add
widthandheightattributes, or use CSSaspect-ratio, so the browser reserves the space before the file arrives. - Reserve space for anything injected later. Cookie banners, promo bars, ads and embeds should have a fixed height container, or appear as an overlay that does not push content down.
- Tame font swaps. A fallback font with very different proportions makes text reflow when the web font loads. Preload your main font file and pick a close fallback.
- Animate with transform. Animating
top,heightormarginmoves other elements. Usetransformandopacityinstead.
/* Reserve the space before images and embeds load */
img, video { max-width: 100%; height: auto; }
.video-embed { aspect-ratio: 16 / 9; width: 100%; }
.promo-bar { min-height: 48px; }   /* the banner can't push the page down */
After the fix: how long until it shows as passed?
Because the assessment uses 28 days of real user data, your PageSpeed Insights field data will not turn green the next day. In Search Console you can click "Start tracking" on a fixed issue, which starts a 28 day monitoring period, as described in the Core Web Vitals report help page. Meanwhile I check the lab results and the Web Vitals numbers in Chrome DevTools to confirm the fix works before the field data catches up.
FAQ
Why does PageSpeed say passed on desktop but failed on mobile?
Mobile visitors have slower processors and networks, so the same page takes longer to load and respond. Google assesses mobile and desktop separately, so fix mobile first.
My Lighthouse score is 90+, so why am I failing?
Lighthouse is a single simulated test. The assessment uses real visitor data from the last 28 days. Third party scripts, real devices and slow connections often make field results worse than lab results.
Will a caching plugin fix Core Web Vitals?
It often helps LCP by speeding up the server response. It rarely fixes INP or CLS on its own, because those come from JavaScript and layout problems.
What if there is no field data for my site?
New or low traffic sites may not have enough Chrome data. Use the lab results to guide fixes and check again once traffic grows.
Need a second pair of eyes?
If your site is failing the assessment and you are not sure where to start, I can audit it, tell you exactly which metric is failing and why, and fix it, whether it is WordPress, Laravel or custom PHP. Send me your URL and I will take a look.